Japan Solar Update: No.172 (Oct 27 ~ 31, 2025)
Japan’s updated outlook for FY 2025 projects a rise in renewable energy output curtailment across several regions. Kyushu is expected to record the highest curtailment rate at 5.9%, followed by Shikoku (3.8%), Tohoku (3.0%), and Chugoku (1.5%). The increase reflects the expansion of renewable capacity—77.4 GW of PV and 6.1 GW of wind as of March 2025—along with weather variations and reduced electricity demand in some areas.
<Key points>
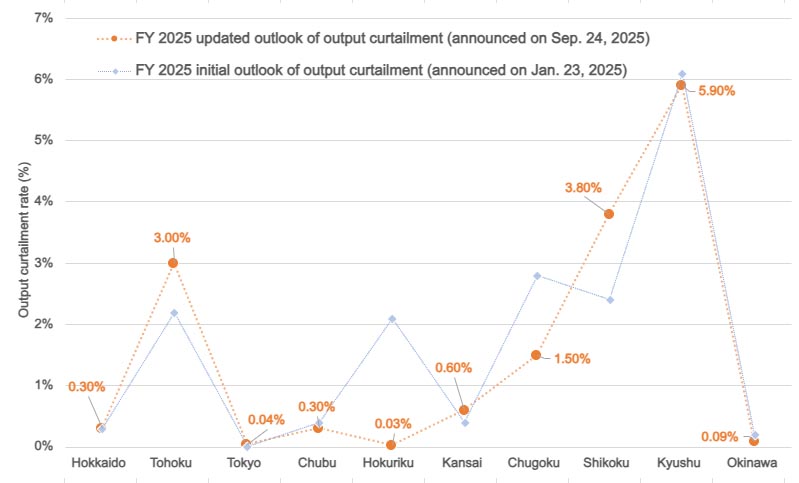
- The outlook for renewable energy output curtailment for FY 2025 has been updated: the Kyushu area is projected to have the highest curtailment rate at 5.9%, followed by the Shikoku area at 3.8%, the Tohoku area at 3.0%, and the Chugoku area at 1.5%
- Compared with the initial outlook for FY 2025, output curtailment rates have increased in the Tohoku, Tokyo, Kansai, and Shikoku areas
- The main factors behind this increase are the increase in renewable energy installed capacity, fluctuations in weather conditions such as solar radiation, and decreased demand in some areas
- The renewable energy installed capacity assumed in the outlook reflects the PV installed capacity of 77.4 GW and wind installed capacity of 6.1 GW as of the end of March 2025, incorporating the latest capacity additions and planned grid connection capacity
FY 2025 updated outlook of renewable energy output curtailment
 The interconnection line utilization rate is calculated mainly based on the most recent performance (during the low demand period)
In the FY 2025 updated outlook of renewable energy output curtailment, the output curtailment rate is projected to increase in the Tohoku, Tokyo, Kansai, and Shikoku areas compared to the initial outlook for FY 2025
Estimate assumptions for FY 2025 updated outlook of renewable energy output curtailment
installed capacities of renewables, etc.
Adding the recent increase in installed capacity and the planned grid connection capacity to the installed capacities at the end of March 2025 (PV: 77.4 GW and wind: 6.1 GW)
Main factors for the changes in output curtailment rates (comparison with specifications in the initial outlook for FY 2025)
Factors for the increase: Increase in the renewable energy installed capacities, fluctuations in weather conditions such as increase in solar radiation, decrease in demand in some areas, etc
Factors for the decrease: Increased demand in some areas, shutdown of operations (thermal power, etc.) due to breakdowns and periodic inspections, improvement in interconnection line utilization rate, etc
Figure 1 Summary of updated outlook of renewable energy output curtailment in FY 2025
Source: Materials of the 4th meeting of the Working Group on the Next-Generation Electric Grid (September 24, 2025), compiled by RTS Corporation