
Japan Solar Update: No.220 (Sept 28 ~ Oct 2, 2026)
As renewable energy deployment continues to expand across Japan, output curtailment is becoming an increasingly important challenge.
Measures to reduce renewable
energy output curtailment
energy output curtailment
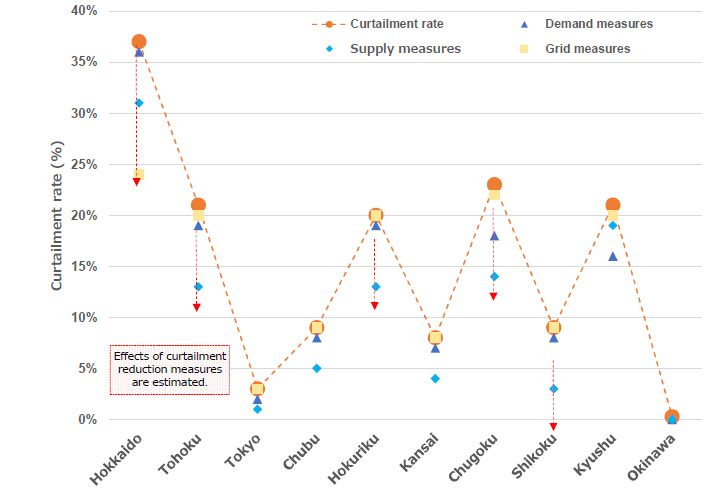
Calculations were made, assuming the implementation of demand measures,
supply measures, and grid measures
supply measures, and grid measures
① Demand measures: It is assumed that storage batteries create demand equivalent to 10% of the minimum demand in each area, with a storage duration of six hours.
② Supply measures: It is assumed that the minimum output of thermal and other power generation facilities is uniformly reduced to 30% for thermal power and 50% for biomass power.
③ Grid measures: Based on the master plan, it is assumed that interregional connection lines currently under planning are developed and reinforced (Hokkaido ⇔ Tohoku ⇔ Tokyo: +2 GW, Kyushu ⇔ Chugoku: +1 GW).
④ FIP transition case: It is assumed that 25% of PV and wind power transitions to the FIP program, and that co-located battery storage capacity is 3 kWh per 1 kW of PV power generation and 0.64 kWh per 1 kW of wind power generation.
Figure 1 Estimates of Installed Capacities and Other Factors in the Long-Term Outlook on Renewable Energy Output Curtailment
Source: Materials of the 12th meeting of the Working Group on Stable Electricity Supply (August 6, 2026), compiled by RTS Corporation
<Key points>
- As a result of calculating the output curtailment rate, Hokkaido showed a high rate of 37%; however, this was reduced to 24% through grid measures. In other areas, the curtailment rate was reduced through demand measures and supply measures
- The output curtailment rate after the review of the priority dispatch rules was calculated. In the FIP transition case, in which the FIP ratio is 25%, the results suggest that, after the change in dispatch order, the curtailment rate under the FIP program tends to decrease compared with that under the FIT program
Calculation Results for the Outlook on Renewable Energy Output Curtailment for FY 2035
Output Curtailment Rates for PV and Wind Power under Unlimited, Uncompensated Rules
Calculation Results after the Review of the Priority Dispatch Rules
FIP transition case (FIP ratio: 25%)
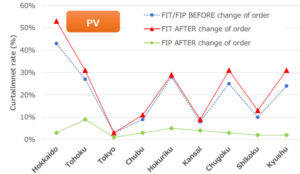
Figure 2 Summary of Calculation Results for the Long-Term Outlook on Renewable Energy Output Curtailment Source: Materials of the 12th meeting of the Working Group on Stable Electricity Supply (August 6, 2026), compiled by RTS Corporation